About
Automating Gym Climbing Scorecards with Google Forms
I used Google Forms and Sheets to automate the scoring process for a climbing competition and made videos so people would be able to use and understand the system after I stopped working there.
Overview of Automating Gym Climbing Scorecards with Google Forms
Motivation: I took on this task as something fun to do with my extra time at the gym and a way to make my coworker's lives easier (in theory). I love coming up with new ways to streamline processes and I wanted some data to play with to try to get to know our climbers better.
Process: The entire process was super simple. Google Forms and sheets are very user-friendly, especially for someone with a CS minor and solid coding skills. At the beginning of the comp the climber takes a score card (can be found below in documents. I also designed these) and as they're working on the competition the fill it out. Then at the end they scan the QR code on the scorecard and fill out the info on the form. It then goes to a google sheet that automatically tallies up the points. It's a simpler process for bouldering comps because boulder grades are just numbers you can plug into a formula. For the ropes grades I had to use a v-lookup table that corresponded to a simplified numerical system. I also used an exponential formula for the ropes grades rather than a linear one. Both forms used another lookup table to find what point value (based on grade) corresponded to each route. Then I sorted the climbers into male and female, and then by point value and by total attempts. If two people had the same number of points the one with fewer attempts got a higher score. They also got labeled and color-coded as "beginner", "intermediate", or "advanced" based on point value.
Impact: This process made scoring a lot faster and simpler. I also made videos explaining how to use the scorecards so that the gym could continue to use them after I left.
Data Gathering: I added a question to the form about what route was the person's favorite and I also analyzed which ones got climbed the most. We were able to see our climber's skill level and what they liked the best that way. I totaled up how many times each route appeared in people's top 3 hardest rock climbs and made a pie chart.
User Experience: If I were to do this again I would mainly tweak the design of the scorecards to put the QR code on the front with the list of rock climbs. Some people did not see it or fill out the form and their cards did not get scored. I would have also taken a more active role in making sure all of the other staff members knew about the online scoring since some misinformation on that topic got shared.
Images
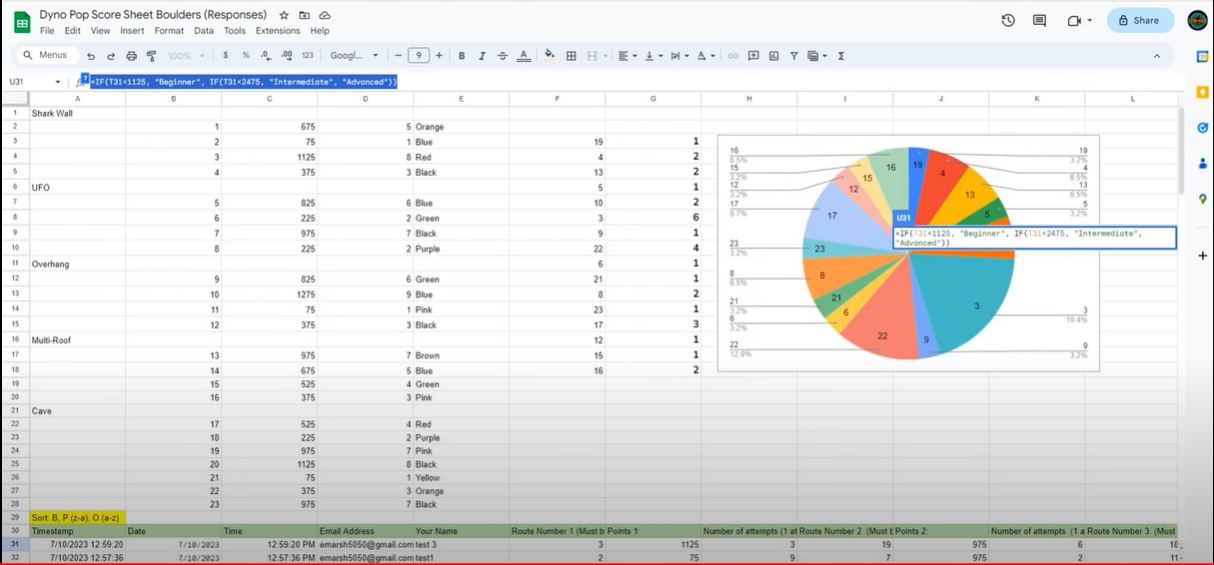
Image of the pie chart that shows how many times each route has been climbed.